Introduction
With the help of a specific exporter, which queries the Proxmox VE API in the background, an existing Prometheus (and Grafana) stack can scrape data about your Proxmox VE environment.
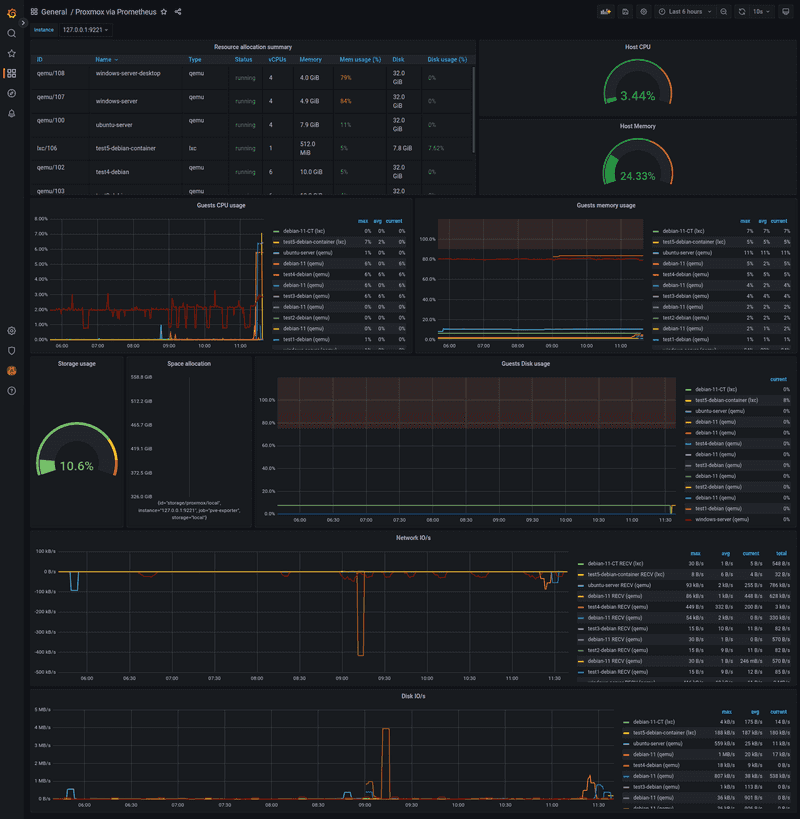
At the end of this tutorial, we will be able to gather metrics about CPU, RAM, disk and network resources of guests (containers or virtual machines) via Prometheus. With a Grafana dashboard, you can view these metrics.
Prerequisites
This tutorial does not cover the installation of Proxmox VE and Prometheus itself. See Install and Configure Proxmox VE and Installation and configuration of the Prometheus Metrics stack tutorials for more information on those subjects.
This tutorial has been tested on Debian 10 and 11.
The Prometheus Proxmox VE Exporter can be started on the Proxmox VE node itself or on another machine.
For this tutorial, we assume the Prometheus Proxmox VE Exporter will run on the Proxmox VE node.
You will need:
- Hetzner dedicated (bare-metal) server.
- Functional
Proxmoxinstallation. - Functional
Prometheusstack. - SSH access with
rootprivileges.
Step 1 - Create Proxmox VE API User
We will create a dedicated Proxmox VE user because anonymous data collection is not permitted. This user will have read-only permissions.
Log in to your Proxmox VE host, ensure you're working as root, and add a new user into Proxmox VE with the following command:
pveum user add pve-exporter@pve -password <password>pve-exporter@pve— a username of a new Proxmox VE user.-password <password>— set a password for that user. Replace<password>with the actual password.
After that, add the role PVEAuditor for the newly created user:
pveum acl modify / -user pve-exporter@pve -role PVEAuditor/— first argument is an access control path,everythingin this case.-user pve-exporter@pve— specify the user.-role PVEAuditor— specify role for that user.
Step 2 - Create Linux User
In order to run the exporter as daemon, create a dedicated system user:
useradd -s /bin/false pve-exporter-s /bin/false— set login shell to/bin/falsein order to disable interactive login.pve-exporter— user's login name.
Step 3 - Create Virtual Environment
The Prometheus Proxmox VE Exporter is written in Python, and we will install it within a so called venv (virtual environment). The use of such a virtual environment makes Python dependency handling much easier compared to a regular installation with pip.
Install python3-venv with the following commands:
apt update
apt install -y python3-venv
And create a new virtual environment:
python3 -m venv /opt/prometheus-pve-exporterStep 4 - Install Prometheus Proxmox VE Exporter
Activate the virtual environment:
source /opt/prometheus-pve-exporter/bin/activateCheck if (prometheus-pve-exporter) is present in front of your command line prompt before executing the next command.
Install prometheus-pve-exporter:
pip install prometheus-pve-exporterOn Debian 10, the error message Failed building wheel for MarkupSafe may be displayed. This is not an issue, simply verify that everything has been installed by executing the command again. It should finish in very short time and all lines should begin with Requirement already satisfied.
Finally, leave the virtual environment by executing deactivate.
deactivateStep 5 - Configure Prometheus Proxmox VE Exporter
Place the previously created credentials for Proxmox VE user pve-exporter@pve in the /etc/prometheus/pve.yml file.
default:
    user: pve-exporter@pve
    password: <password>
    verify_ssl: false
Also, set the file owner and the permissions:
chown -v root:pve-exporter /etc/prometheus/pve.yml
chmod -v 640 /etc/prometheus/pve.yml
Step 6 - Create Systemd Service
Add the following content to the /etc/systemd/system/prometheus-pve-exporter.service file:
[Unit]
Description=Prometheus Proxmox VE Exporter
Documentation=https://github.com/prometheus-pve/prometheus-pve-exporter

[Service]
Restart=always
User=pve-exporter
ExecStart=/opt/prometheus-pve-exporter/bin/pve_exporter --config.file /etc/prometheus/pve.yml

[Install]
WantedBy=multi-user.target
Reload systemd, enable and start the service.
systemctl daemon-reload
systemctl enable prometheus-pve-exporter.service
systemctl start prometheus-pve-exporter.service
Verify that pve_explorer is listening to TCP port 9221 (which is the default) with the ss -lntp | grep 9221 command. The output should look similar like this:
LISTEN 0 128 0.0.0.0:9221 0.0.0.0:* users:(("pve_exporter",pid=866529,fd=5),("pve_exporter",pid=866529,fd=3))In some configurations it is necessary to note the IP address in front of :9221. You will need it in the next step. Normally pve-exporter binds to 0.0.0.0, which means that you can reach the exporter over every interface.
Step 7 - Test functionality
Access the endpoint which provides the metrics via curl.
curl --silent http://127.0.0.1:9221/pve | grep pve_version_infoCheck output of that command. It should be similar to the following:
# HELP pve_version_info Proxmox VE version info
# TYPE pve_version_info gauge
pve_version_info{release="7.2",repoid="963997e8",version="7.2-15"} 1.0
Step 8 - Extend Prometheus Configuration
Extend the scrape_config section in your existing Prometheus configuration with the following lines:
  - job_name: 'pve-exporter'
    static_configs:
      - targets:
        - 127.0.0.1:9221
    metrics_path: /pve
    params:
      module: [default]
And then apply the changes:
systemctl reload prometheusStep 9 - Import Grafana Dashboard
Log in to your Grafana instance, navigate to Dashboards, press the import button, insert the ID 10347 and click load.
You can find the dashboard here: https://grafana.com/grafana/dashboards/10347
Now, you can see data in your Grafana (it may take a bit of time to collect information from Prometheus).
Conclusion
With the great Prometheus Proxmox VE Exporter we have a simple and powerful tool which allows us to see how much resources each guest on the Proxmox VE node takes. Additionally, it provides us with a general overview of Proxmox VE host system health as well as resources (CPU, memory, disk, network I/O, disk I/O) usage for containers and virtual machines running on your Proxmox VE host.

