Introduction
Prometheus is a cloud-native metrics and monitoring solution. It can get metrics from any type of data sources, for example web servers, system usage, or networking equipment.
This tutorial covers the basic steps to query the performance data of a server and show it in a dashboard using Grafana.
Prerequisites
- 2 Debian 11 servers
- Allow TCP port 9100 in the iptables firewall or the Cloud Firewall for incoming traffic (INPUT chain) on the monitored node
- Allow TCP port 3000 in the iptables firewall or the Cloud Firewall for incoming traffic (INPUT chain) on the monitoring server
Test Setup
Below, we use node1.example.com to refer to monitored node, and prometheus.example.com to refer to monitoring server.
Step 1 - Install Node Exporter on monitored node
The Prometheus stack consists of multiple components. The metrics storage is Prometheus itself, which scrapes metrics in periodic intervals from http endpoints. These endpoints can be provided by any software. You can find a list of exporters and integrations here.
For this tutorial, we will use Node Exporter to get basic system metrics such as cpu usage, network throughput or disk I/O metrics.
The following commands install and configure the node_exporter on the target (monitored node).
apt update
apt install prometheus-node-exporter
Now, the http endpoint of the exporter should listen at tcp port 9100. Any http client like curl is able to request the metrics.
The following command shows current metric values for systemd units.
root@node1.example.com:~# curl -s http://127.0.0.1:9100/metrics | grep node_systemd_units
# HELP node_systemd_units Summary of systemd unit states
# TYPE node_systemd_units gauge
node_systemd_units{state="activating"} 0
node_systemd_units{state="active"} 146
node_systemd_units{state="deactivating"} 0
node_systemd_units{state="failed"} 0
node_systemd_units{state="inactive"} 70
Step 2 - Install Prometheus server on monitoring server
The Prometheus server is used to collect the exposed metrics of Node Exporter(s) into a time series database called OpenTSDB. It can be installed as follows.
apt update
apt install prometheus jq
The Prometheus server must be configured to know the Node Exporter metrics endpoint address. Add the following job description in the scrape_configs section in the file /etc/prometheus/prometheus.yml.
scrape_configs:
  - job_name: 'node_exporter at node1'
    static_configs:
- targets: ['node1.example.com:9100']job_namea human readable name of the jobstatic_configscontains configuration for the hosts with static IPstargetscontains an array of<host>:<port>to connect to
Finally, reload the Prometheus service in order to apply new config.
systemctl reload prometheus.serviceThe command systemctl status prometheus confirms the successful reload of the service.
To view the status of monitoring targets, you can execute the following command:
root@prometheus.example.com:~# curl --silent 127.0.0.1:9090/api/v1/targets | jq -r '.data.activeTargets[]|.scrapeUrl,.health,.lastError'The output should look as follows:
http://node1.example.com:9100/metrics
up
Step 3 - Setup Grafana dashboard on monitoring server
Now that the Prometheus server is continuously collecting metrics from our node, the data is stored for 15 days. There are multiple ways to display the metrics. The widely used way is to setup Grafana which is a dashboard server for multiple data sources.
Enable the Grafana repository and install Grafana on prometheus.example.com with the following commands:
apt install apt-transport-https software-properties-common wget
wget -q -O - https://packages.grafana.com/gpg.key | apt-key add -
echo "deb https://apt.grafana.com stable main" > /etc/apt/sources.list.d/grafana.list

apt update
apt install grafana
Finally, enable and start the Grafana daemon:
systemctl enable grafana-server.service
systemctl start grafana-server.service
Step 4 - Configure Grafana data source and dashboard
Grafana provides a web interface. Please note that our Grafana setup us not secure at this stage. Therefore, be careful to use only credentials for testing while the connection between your browser and the dashboard server is not secure.
You can access the interface by browsing to:
http:/The default credentials are as follows:
- Username: admin
- Password: admin
After login, you are asked to change this password.
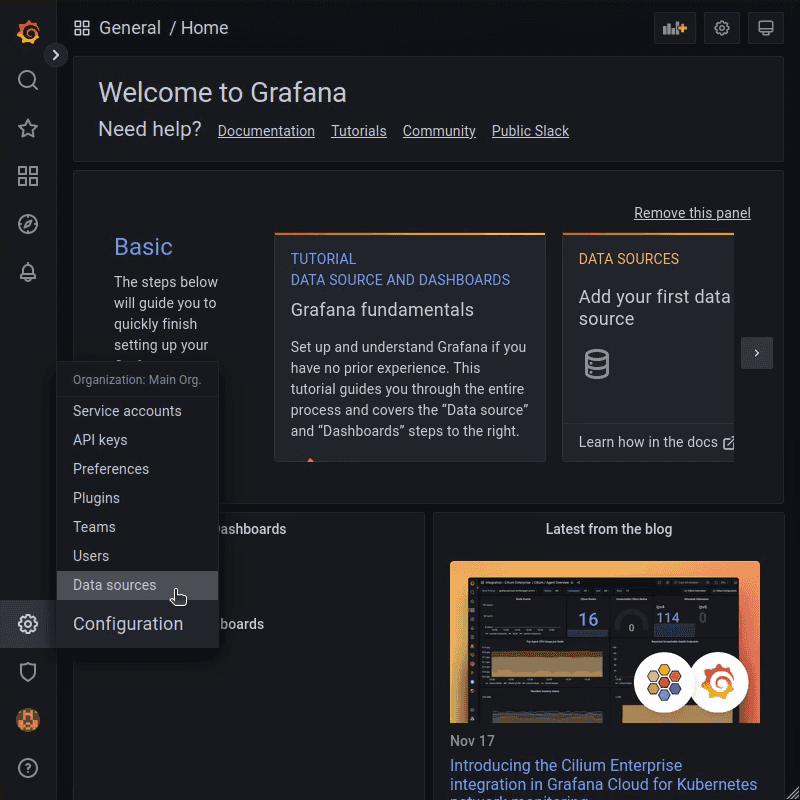
In this state, there is no data source or dashboard configured. First, add a data source.
Select data source type Prometheus and enter http://localhost:9090 into the URL field.
After that, click the Save & test button to create the data source.
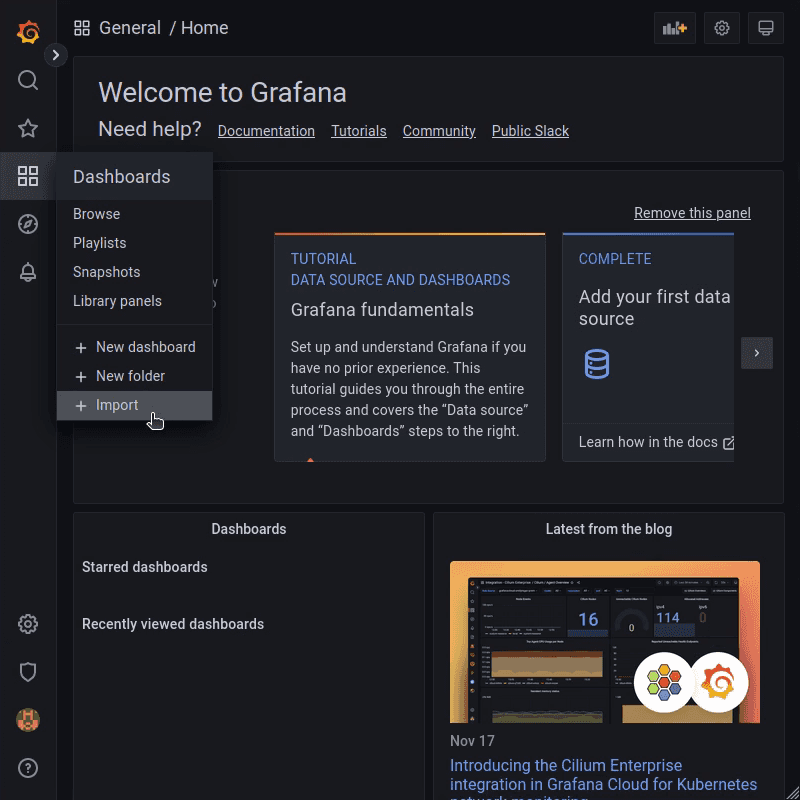
There are two ways to create dashboards. You can create every panel individually or import predefined dashboards from the community. For displaying node_exporter metrics, a good dashboard can be found here.
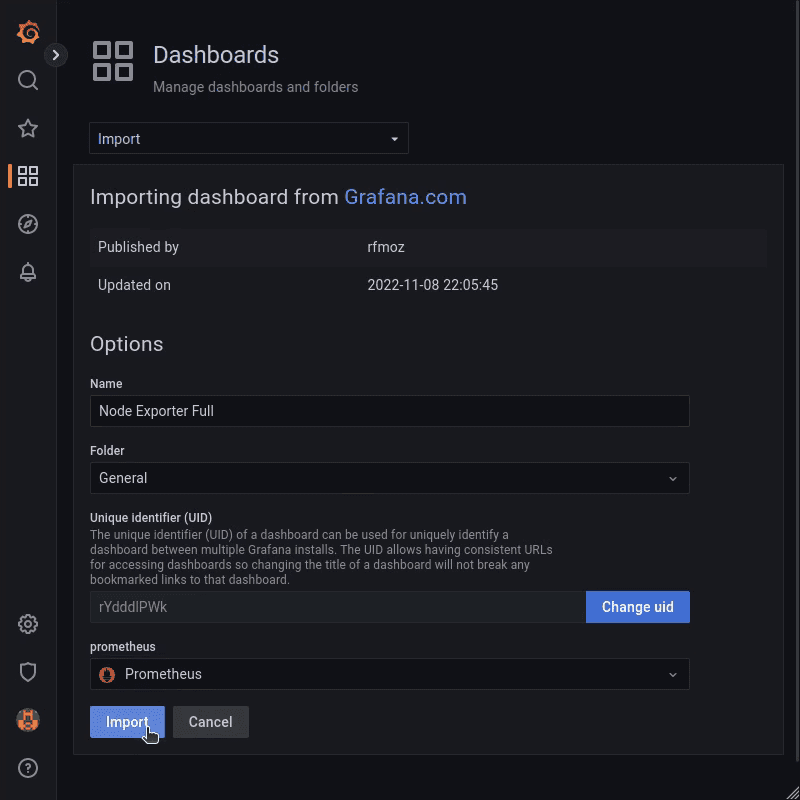
Copy the ID to import the dashboard into your Grafana.
Press the + Import button, insert the copied ID and click Load. You need to select the Prometheus data source for the dashboard:
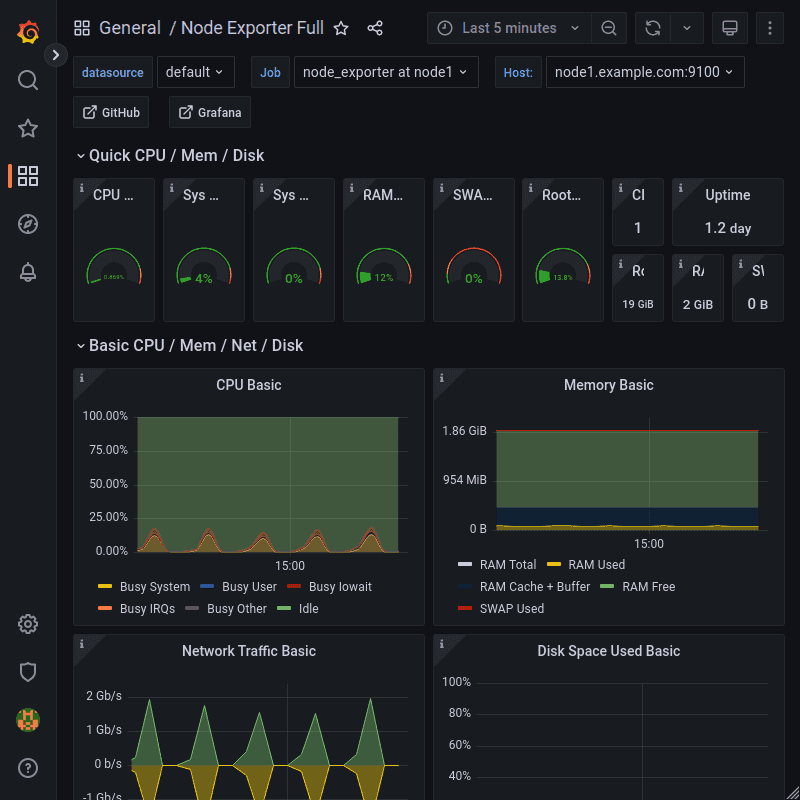
Finally, the Dashboard is imported and displays the data of the monitored node.
Conclusion
You now have configured a Prometheus stack and can monitor a single node. This setup has the capability of monitoring more nodes/services.
Please consider to apply an SSL-enabled reverse proxy in front of the Grafana frontend as described in this article in the section "Step 5 - Install Nginx".
When you edit the prometheus.yml file to add a new job in the scrape_configs section, you can not only use the static_configs parameter to get information from a specific host. Instead, you could also use one of the official service-discovery mechanisms available for Prometheus. With this method, Prometheus will dynamically discover all available hosts and automatically add them as targets. To learn how to dynamically add Hetzner Dedicated and Cloud server targets from your Hetzner account, refer to our Prometheus Service Discovery article.


